
World Gas is often referred to by the industry as “shale plays”. FracTracker, based in Pennsylvania is the best source for data regarding fracking around the world.
FracTracker Alliance, maps, analyzes, and communicates the risks of oil, gas, and petrochemical development to advance just energy alternatives that protect public health, natural resources, and the climate.
They collect data and then analyze, interpret, and map the results. They offer
maps of every US state with active drilling and have created hundreds of thematic maps and analyses.
(Editor’s Note: This project, as far I can tell has been online snce 2010 and is still publishing in 2025! See also: map of Ukraine below from 2022)
See the first archived post: Sam Malone. Today Is a Good Day in Pa. 17 Jun 2010. FracTracker – Marcellus Shale Data Tracking.
The Independent Regulatory Review Commission just passed two revisions to Chapter 102 and one to Chapter 95 that help to protect our waterways from natural gas drilling. The new rules will require that drillers treat the wastewater produced from hydraulic fracturing to drinking water standards if they want to dispose of it in PA’s waterways. Why is this important? The other rules will require some developers to maintain or create a 150-foot natural vegetative buffer beside PA’s best rivers & streams.
Download the FracTracker Press Kit one pager (PDF 7MB).
Many issues such as the reach of pipelines take on international scopes. This section contains all of FrackTracker’s content that focuses on drilling and issues affecting regions outside of the U.S.
Map Last Updated: November 2017
An interactive version of the map may be found here:
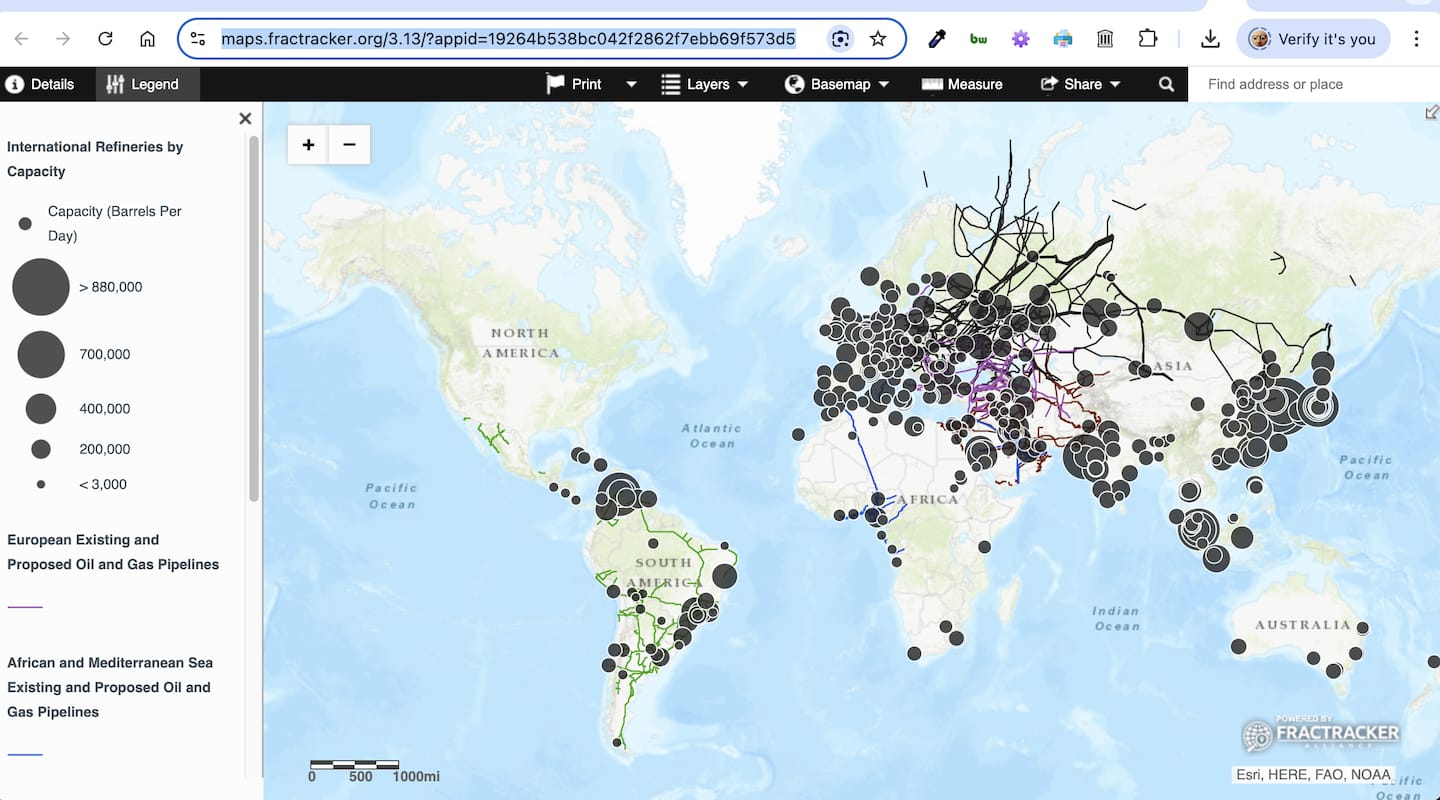
African and Mediterranean Sea Existing and Proposed Oil and Gas Pipelines
CONTACT US
Office: 216 Franklin St, Ste 400, Johnstown, PA 15901
Email: info@fractracker.org
Phone: (717) 303-0403
Social Media:
Facebook: @FracTracker Instagram: @FracTracker
Twitter:@FracTracker
In 2022, Russia invaded Ukraine and seized the territories associated with the large natural gas reserves held by Ukraine.
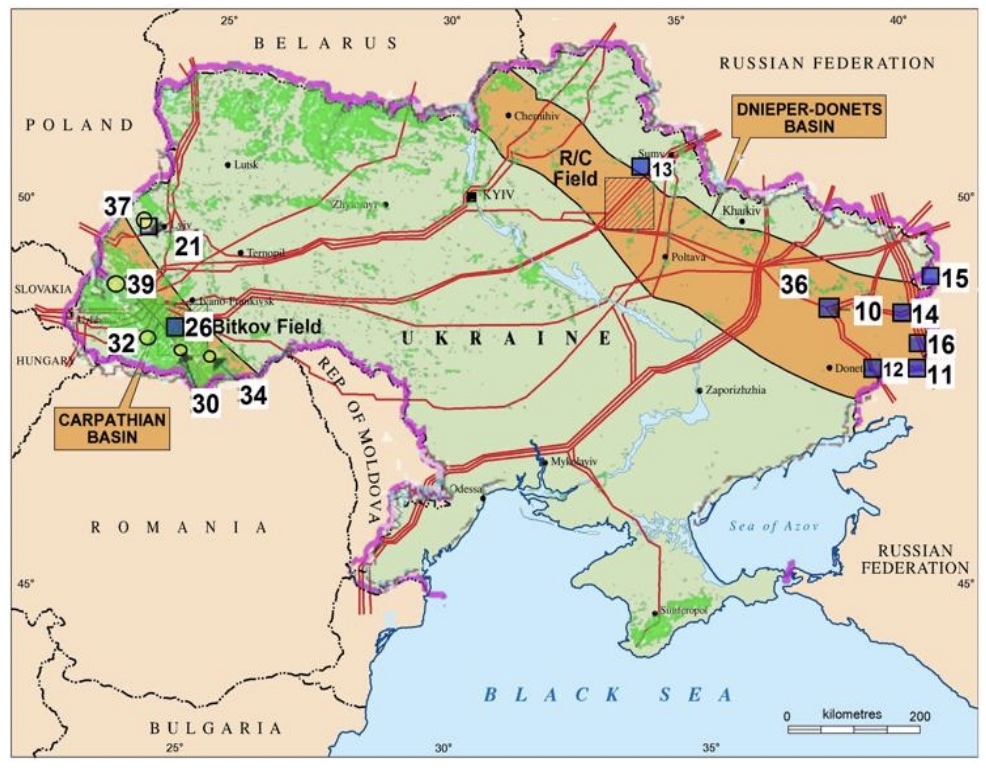
See also: Vinson & Elkins. Ukraine: Global Fracking Resources. 2016.
See also: Jonathan Masters. Ukraine: Conflict at the Crossroads of Europe and Russia. 14 Feb 2023. Council on Foreign Relations.
See also: The fracking debate: Terry Engelder at TEDxPSU. Youtube. 24 Jun 2013.
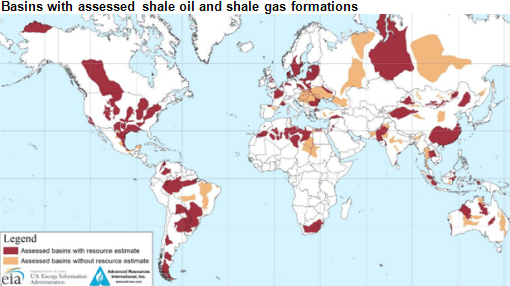
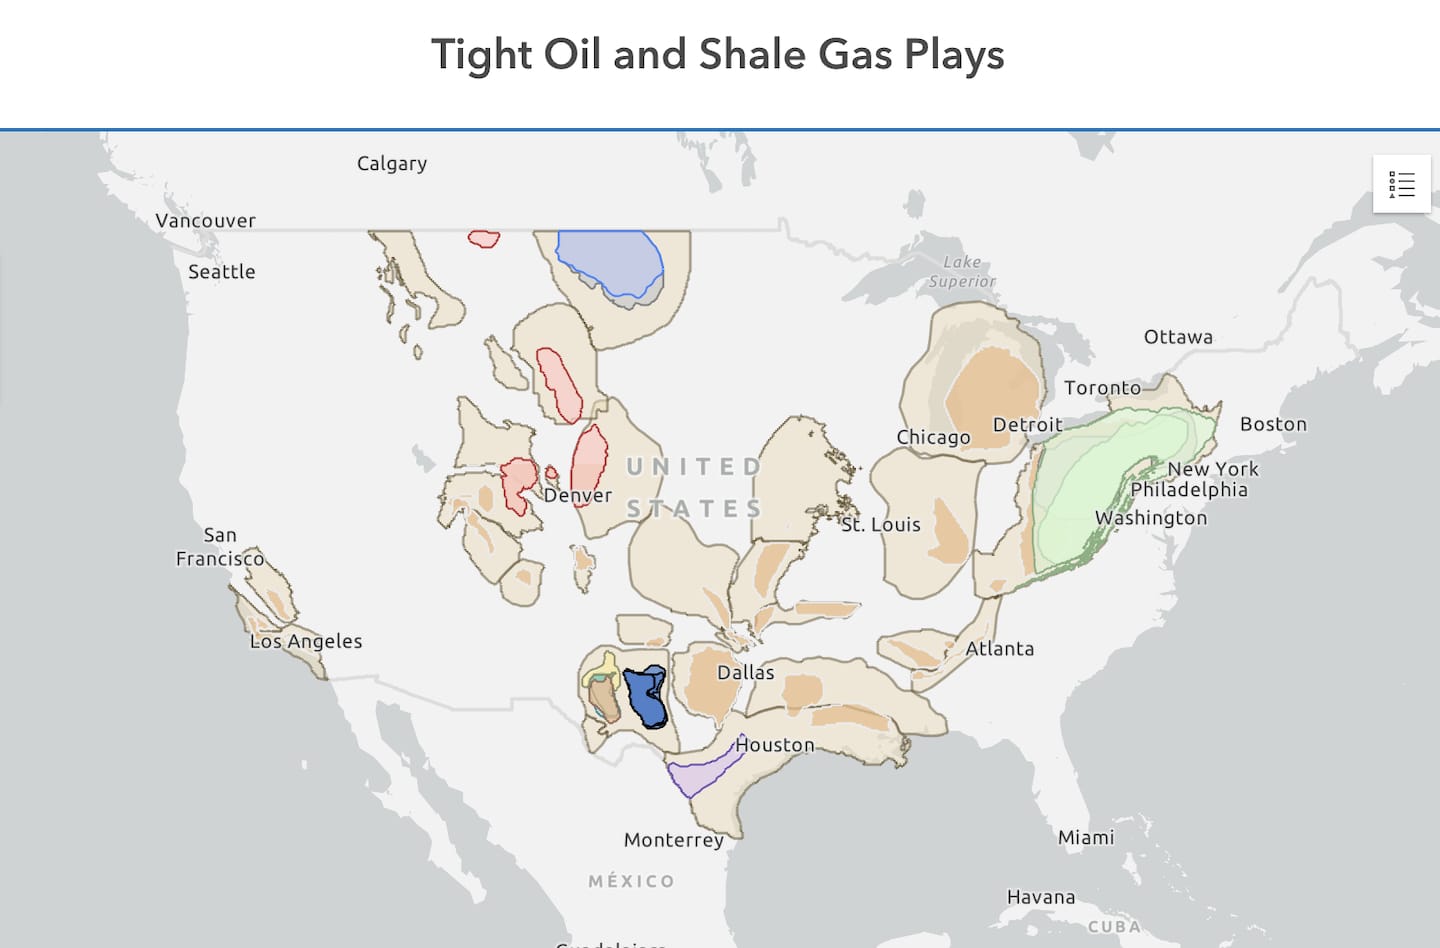
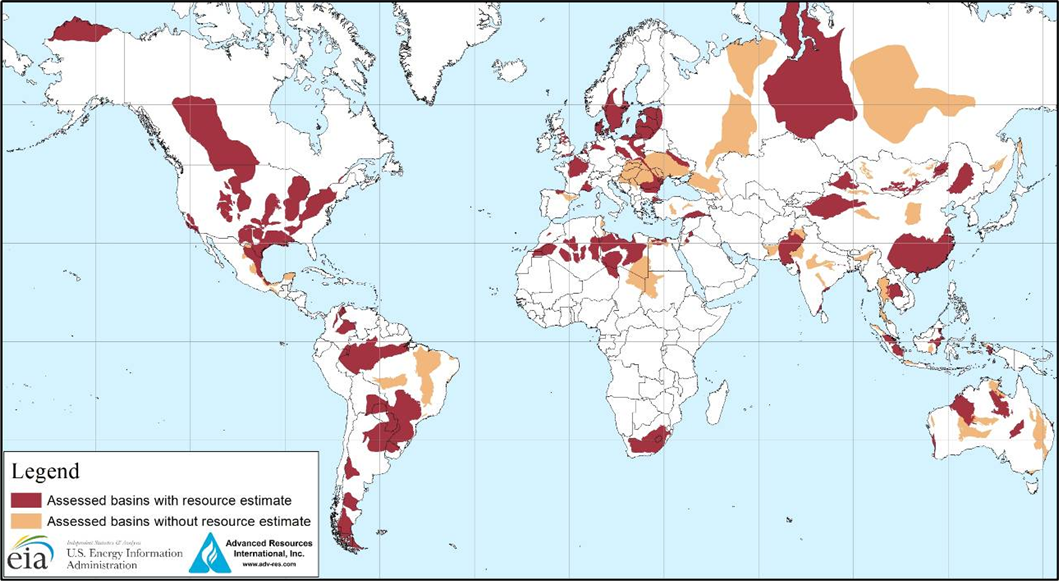
Other very good sources for maps and data may be found at the website of the U.S. Energy Information Administration.
Estimated shale oil and shale gas resources in the United States and in 137 shale formations in 41 other countries represent 10% of the world’s crude oil and 32% of the world’s natural gas technically recoverable resources, or those that can be produced using current technology without reference to economic profitability, according to a new EIA-sponsored study (see Table 1) released today (June 10, 2013).

Note: Click to enlarge.
The site was last updated in 2013 during the Obama administration.
Here is a chart that shows how US Natural Gas Production has doubled since 2007.
Short-Term Energy Outlook Data Browser
Release Date: Dec. 10, 2024 | Next Release Date: Jan. 14, 2025
While gas production has increased in the last 20 years, consumption has remained relatively flat in the U.S. indicating a growth in the export market.
See also: U.S. Energy Information Administration, interactive map.
See also: Kondash, Andrew J., Nancy E. Lauer, and Avner Vengosh. “The intensification of the water footprint of hydraulic fracturing.” Science advances 4.8 (2018): eaar5982.
Unconventional oil and gas exploration in the United States has experienced a period of rapid growth, followed by several years of limited production due to falling and low natural gas and oil prices. Throughout this transition, the water use for hydraulic fracturing and wastewater production in major shale gas and oil production regions has increased; from 2011 to 2016, the water use per well increased up to 770%, while flowback and produced water volumes generated within the first year of production increased up to 550%. The water-use intensity (that is, normalized to the energy production) increased in all U.S. shale basins except the Marcellus basin during this transition period. The steady increase of the water footprint of hydraulic fracturing with time implies that future unconventional oil and gas operations will require larger volumes of water for hydraulic fracturing, which will result in larger produced oil and gas wastewater volumes.
Kondash, Andrew J., Nancy E. Lauer, and Avner Vengosh. “The intensification of the water footprint of hydraulic fracturing.” Science advances 4.8 (2018): eaar5982.
See also: Igor Faynzilbert. Shale Gas Race: Political Risk in China, Argentina and Mexico. Vol. 2, No. 1. Jan 2014. Journal of Political Risk.
As the world continues to embrace cleaner and more efficient sources of energy over the next 25 years, natural gas stands to gain a large market share at the expense of less efficient and more pollutant coal and wood. The United States is currently the biggest winner from hydraulic fracturing and horizontal drilling that allow significantly increased production of shale gas. However, China, Argentina and Mexico are also potential gainers from these new technologies if they manage to overcome political and infrastructure challenges that have considerably slowed development of new gas fields.Global energy demand is projected to increase 35% by 2040, according to recently-issued Outlook for Energy 2014 from ExxonMobil. Most of that growth will be caused by increased urbanization in non-OECD countries such as China, India, Brazil, Indonesia, Saudi Arabia, Iran, South Africa, Nigeria, Thailand and Egypt, where the proportion of urbanites will increase to about 60% in 2040 from 45% in 2010. The increase in the number of households from 1.9 billion in 2010 to 2.8 billion in 2040 along with improved living standards will drive demand for energy and cleaner energy sources.1
1: 2014 ExxonMobil Energy Outlook”, http://corporate.exxonmobil.com/en/energy/energy-outlook. Accessed January 5th, 2014.
…Globally depleting oil and gas reserves are forcing companies to seek new resources and make concessions to local governments. Despite challenges that companies face in these countries, integrated oil majors are eager to enter these markets and work with their state-owned counterparts in developing shale gas reserves. In addition, lack of infrastructure and technologies, and dependence on new sources of income, will push governments to open their economies and ease their grip on natural resources.
Igor Faynzilbert. Shale Gas Race: Political Risk in China, Argentina and Mexico. Vol. 2, No. 1. Jan 2014. Journal of Political Risk.
See also: World Energy Council
The World Energy Council is the world’s oldest independent and impartial community of energy leaders and practitioners. Through our Humanising Energy vision, we involve more people and communities in accelerating clean and inclusive energy transitions in all world regions.
The World Energy Council actively contributes the insights needed by energy leaders to make effective strategic, policy and business decisions about the energy transition. We provide reliable data, useful tools and impartial comment.
Our interactive Energy Transition Toolkit includes five comprehensive tools that can be used together or separately. They have been proven to drive effective change and bring us closer to achieving a successful energy transition.
“These tools are invaluable because they’re flexible, scalable and adaptable. They give weight to our thinking and allow us to develop strategies so that we can work on the practical solutions needed to tackle energy transition.”
From Wikipedia: The World Energy Council’s publications include annual releases like the World Energy Trilemma Index, which compares Energy security, equity and environmental sustainability on a country-by-country basis[6] (also available as an online tool[7]), as well as Insights Briefs on current energy topics such as Blockchain.[8]
Tools for successful Energy Transition

Annual reality check of 2,000+ energy leaders worldwide focusing on the challenges of energy transition

Better policy through balancing energy security, equity and environmental sustainability

Strategic foresight tool that explores pathways to improve preparation for the energy transition

A framework for emerging and systemic risk management, including new challenges like weather hazards and cyber-security

To help members navigate the shifting innovation landscape
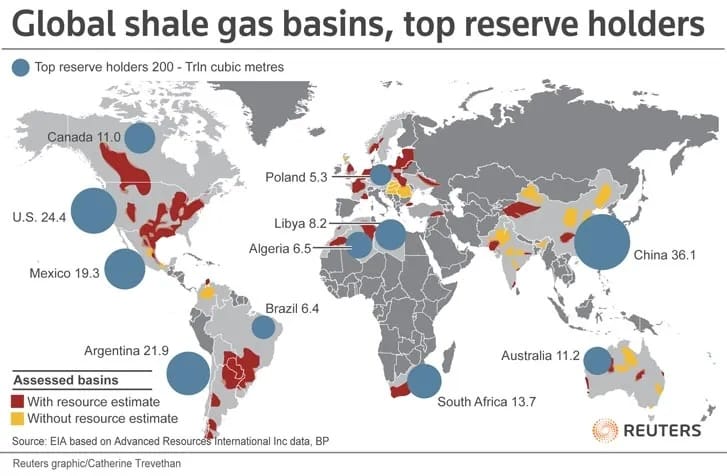
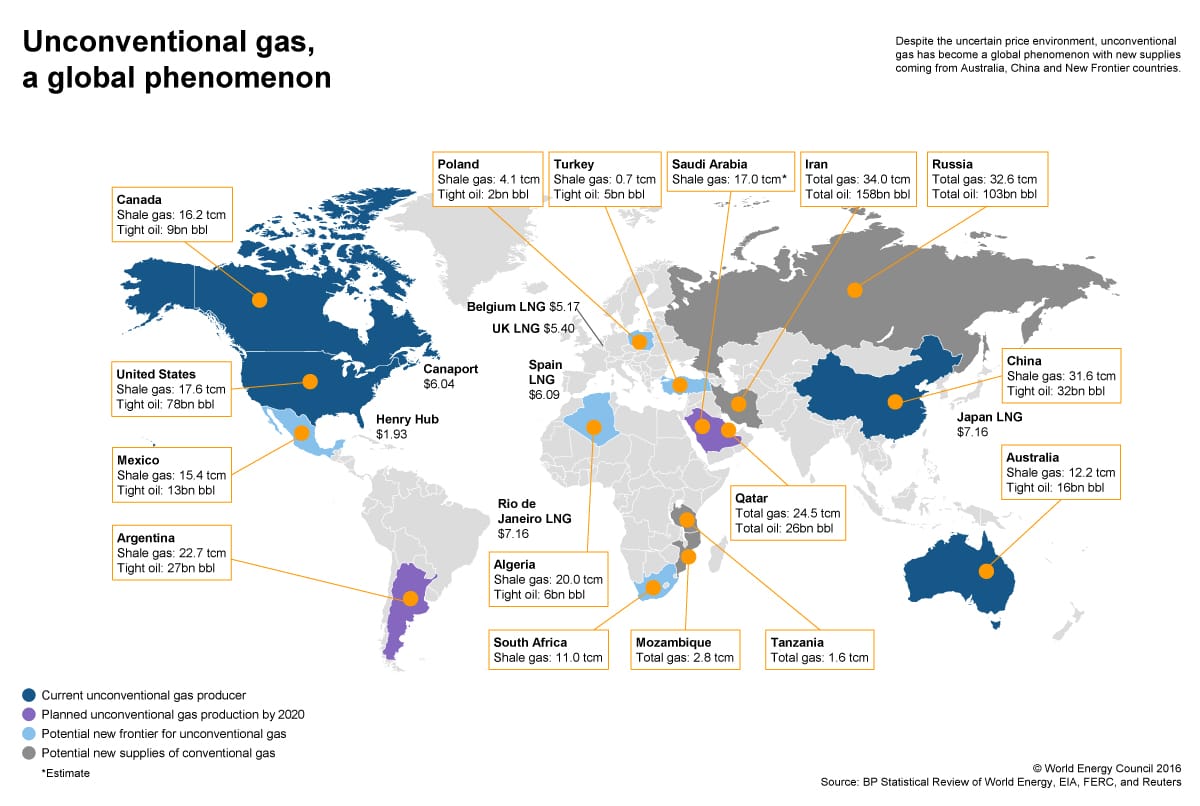
See also: Unconventional Gas, a Global Phenomenon
See also: Shale Gas Information Platform, Basics of Shale Gas
What is shale gas?
Shale Gas is natural gas that is present in shale rocks. Throughout the world, different types of sedimentary rock contain natural gas deposits, for example sandstones, limestones or shales. Sandstone rocks often have high permeability, which means that the tiny pores within the rock are well connected and gas can flow easily through the rock. In contrast, shale rocks usually have very low permeability, making gas production more complex and costly.
See: Gasland’ Filmmaker Takes on Cuomo and ‘Dot.FlatEarth’
See: Flow – The War Between Public Health and Private Interests
See: US natural gas drilling boom linked to pollution and social strife
See: The Yes Men | Climate Pledge of Resistance
See: Poison Fire
See: Anger grows across the world at the real price of ‘frontier oil’
See: Chevron Human Energy Stories | Addressing Climate Change
See: Beware The Green Dragon! | Right Wing Watch
See: Sixty Lame Minutes
See: The risks of oil and gas production acknowledged around the world
See: Eaarth: Making a Life on a Tough New Planet | 350.org Founder Bill McKibben
See: Blue Covenant: The Global Water Crisis and the Coming Battle for the Right to Water


