
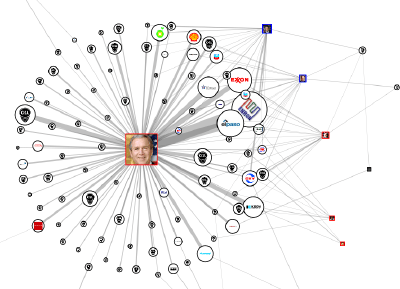
What the heck am I looking at?
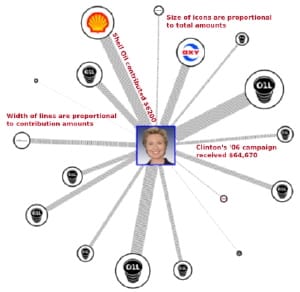
We’ve created maps of political campaign contributions from companies in the oil & gas and coal industries to congressional representatives. These are relationship map of the contribution network. That means that unlike a physical map, where points are positioned at a geographic location, the icons for the companies and representatives are placed so that they are as close as possible to whomever they contribute to or receive contributions from.
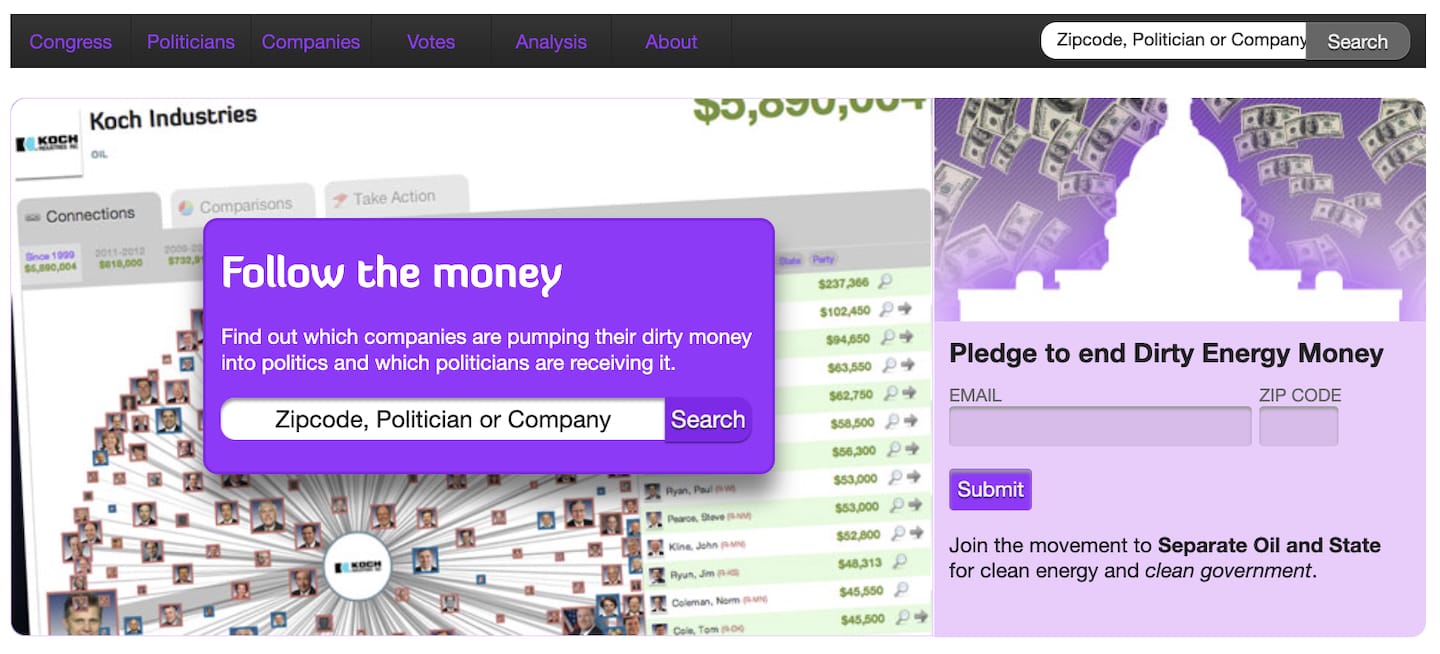
Think of it like a social networking site in which companies and politicians have become ‘friends’ by giving money.
This site is a project of Oil Change International, developed by Greg Michalec and Skye Bender-deMoll (See the current website here: Skyome.net ) and designed by Diligent Creative. Earlier versions of the site were named ‘Follow the Oil Money’ and ‘Follow the Coal Money’.

See also: Wikipedia | Adversarial Design
Adversarial Design is a type of political design that evokes and engages political issues. In doing so, the cultural production of Adversarial Design crosses all disciplinary boundaries in the construction of objects, interfaces, networks, spaces and events. Most importantly, Adversarial Design does the work in expressing and enabling agonism. ( DiSalvo, Carl (2012). Adversarial design. Cambridge, Mass.: MIT Press. ISBN 978-0-262-01738-1.)
Examples include:
- CCD – Me Not Umbrella by Mark Shepard (2009)[4]
- Feral Robotic Dogs by Natalie Jeremijenko (2002)[5]
- Machine Therapy by Kelly Dobson (2007)[6]
- Million Dollar Blocks by SIDL (2003)[7]
- Natural Fuse by Haque Design + Research (2009)[8]
- Oil Standard by Michael Mandiberg (2006)[9]
- Spore 1.1 by Douglas Easterly and Matthew Kenyon (2007)[10]
- State-Machine:Agency by Max Carlson and Ben Cerveny (2005)[11]
- They Rule (2001, 2004, 2011) and Exxon Secrets (2014) by Josh On[12][13]
- Unfluence by Skye Bender-deMoll and Greg Michalec (2007)[14]
Follow-the-oilmoney lives!
See also: Marshall Kirkpatrick.”Data Hacker Pageranks Members of the US Congress.” ReadWriteWeb. Dec. 27, 2010.
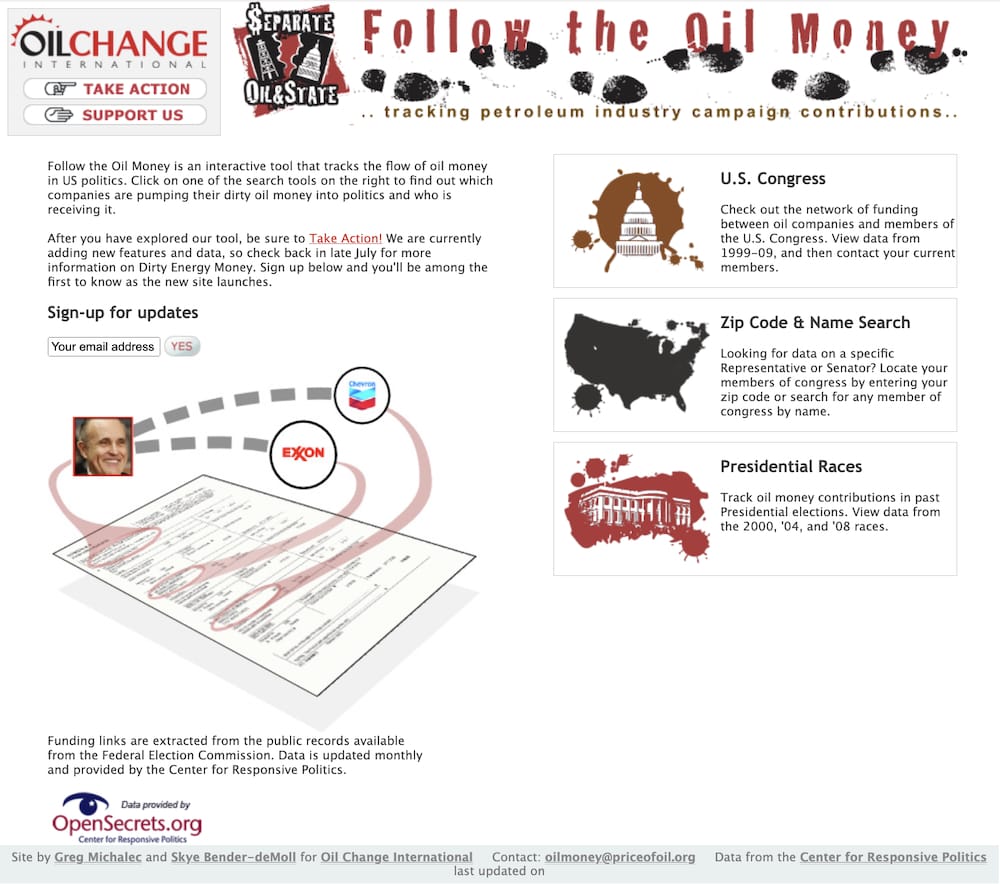
Well, it has not been officially launched yet, but the oil company campaign contribution site we’ve been working on for the last six months is live. It leaked out on blogs this week, and has been getting good reviews and tons of traffic. We are excited!
The site is a project of Oil Change International and another collaboration between myself and Greg Michalec. It shows interactive network maps of campaign contributions to presidential races and members of congress. The same data is also shown in drillable tables, so you can go from a politician, to the contributing oil companies, all the way to the image of the original FEC filing. It also permits searching for congress members by name and constituent zip code.
Dirty Energy Money –> Oil Money, Oil Change.

See also: Owen Poindexter. Budget Proposals Follow Energy Influence: Obama Goes After Producers, Sen. Paul Goes After Regulators. 31 Jan 2011. MAPLight.org – Money and Politics
Submitted by Owen Poindexter on Monday, Jan 31st, 2011
Jan. 31, 2011 – In the 2011 State of the Union address, President Barack Obama proposed eliminating roughly $4 billion annually in tax deductions to oil companies. Recently elected senator of Kentucky, Republican Rand Paul, has released a budget proposal, which would, among other things, fold the Department of Energy (DOE) into the Department of Defense. The DOE oversees domestic energy production, nuclear materials, and the research and development of energy technologies.
In the past decade, campaign donors connected to the industries that the DOE has jurisdiction over gave millions to both Republicans and Democrats, but directed more than two-thirds of the over $147 million in contributions to the GOP. Within individual categories of contributors as defined by the Center for Responsive Politics, Republicans outpaced Democrats in all but one, Independent electric power generators, whose contributions accounted for just over 1% of the whole.
Major multinational oil companies, the group targeted by Obama, gave over three-quarters of the $13.1 million they have contributed to Republicans ($10.1 million). See below for the full list of interest groups and their contributions. (All of the independent legislators in the examined time period caucused with the Democrats, so their numbers are included in the Democrat totals.)
- Total to all legislators since 2001: $147,500,187
- Total to all Republican legislators: $97,547,667
- Total to all Democratic legislators: $49,952,520
Interest Group Democrats Republicans Total Dem% Repub% Coal mining $1,931,134 $ 6,218,829 $8,149,963 24% 76% Electric Power utilities $11,016,763 $15,591,435 $26,608,198 41% 59% Energy production & distribution $2,640,855 $4,364,160 $7,005,015 38% 62% Energy, Natural Resources and Environment $87,330 $102,300 $189,630 46% 54% Fuel oil dealers $69,690 $88,600 $158,290 44% 56% Gas & Electric Utilities $11,460,690 $12,636,446 $24,097,136 48% 52% Gasoline service stations $948,184 $2,227,424 $3,175,608 30% 70% Independent oil & gas producers $1,971,674 $8,865,427 $10,837,101 18% 82% Independent power generation & cogeneration $1,253,015 $614,376 $1,867,391 67% 33% Major (multinational) oil & gas producers $3,000,099 $10,100,258 $13,100,357 23% 77% Natural Gas transmission & distribution $2,737,748 $5,500,562 $8,238,310 33% 67% Nuclear energy $834,554 $1,254,965 $2,089,519 40% 60% Nuclear plant cnsrctn, eqpmnt & svcs $919,568 $1,586,970 $2,506,538 37% 63% Oil & Gas $2,641,572 $8,470,101 $11,111,673 24% 76% Oilfield service, equipment & exploration $1,441,416 $6,544,639 $7,986,055 18% 82% Petroleum refining & marketing $2,474,768 $7,882,114 $10,356,882 24% 76% Power plant construction & equipment $1,387,282 $1,669,007 $3,056,289 45% 55% Rural electric cooperatives $3,136,178 $3,830,054 $6,966,232 45% 55% Total $49,952,520 $97,547,667 $147,500,187 34% 66% Monetary and non-monetary contributions to candidate campaign committees of legislators serving in the 109th, 110th, 111th and 112th Congresses. Includes reported contributions from Electric Power utilities, Energy production & distribution, Energy, Natural Resources and Environment, Gas & Electric Utilities, Independent power generation & cogeneration, Nuclear energy, Nuclear plant construction, equipment & svcs, Coal mining, Power plant construction & equipment, Major (multinational) oil & gas producers, Oil & Gas, Independent oil & gas producers, Gasoline service stations, Petroleum refining & marketing, Natural Gas transmission & distribution, Oilfield service, equipment & exploration, Rural electric cooperatives, and Fuel oil dealers, from Jan 1. 2001-Nov. 22, 2010. Contributions data provided by the Center for Responsive Politics (OpenSecrets.org)
Owen Poindexter. Budget Proposals Follow Energy Influence: Obama Goes After Producers, Sen. Paul Goes After Regulators. 31 Jan 2011. MAPLight.org – Money and Politics
See: GovTrack.us: Tracking the U.S. Congress
See: Big Money Drives Up the Betting on the Marcellus Shale
See: U.S. Speaker Nancy Pelosi: The Gavel: Draining The Swamp
See: Opponents to Fracking Disclosure Take Big Money From Industry
See: What The Frack? Gas Industry’s Multimillion-Dollar Campaign Demonizes Hydraulic Fracturing Bill
See: Smitsky Letter